Infectious Diseases
774 views | +0 today
Infectious Diseases
A curation of the best Articles and Research on Infectious Diseases. (Not a news site, focus on ideas, research, solutions, protocols and discussions related infectious/communicable/tropical diseases.
Curated by nrip
Your new post is loading...
Rescooped by nrip from healthcare technology
Scoop.it!

Ranking the Next Pandemic - Eyes on Disease X

Ranking the Next Pandemic - Eyes on Disease X | Infectious Diseases | Scoop.it

The past several decades have seen an alarming spike in communicable disease outbreaks worldwide. Given a confluence of host, virologic, environmental, and human factors, experts agree that the next pandemic could already be on the horizon.


In a globalized world, changes in how people use land and interact with their ecosystems—such as rapid deforestation and agricultural expansion—have resulted in humans and animals coming into more frequent and intense contact with one another, increasing opportunities for what is known as "zoonotic disease spillover."


In the past few years alone, numerous disease outbreaks have had suspected or confirmed zoonotic origin, including mpox (formerly known as monkeypox), Ebola virus disease, dengue fever, and COVID-19.


Experts also recognize the need to prepare for another possible Disease X, a term used to describe a currently unknown pathogen with pandemic potential.


To direct resources toward the most high-consequence pathogens, it is paramount that leaders have an accurate concept of pandemic risk—for individual viruses as well as viral families. Several institutions are developing disease rankings at national and global levels, including the Priority Zoonotic Diseases Lists facilitated by the U.S. Centers for Disease Control and Prevention and the Research and Development (R&D) Blueprint created by the World Health Organization. 


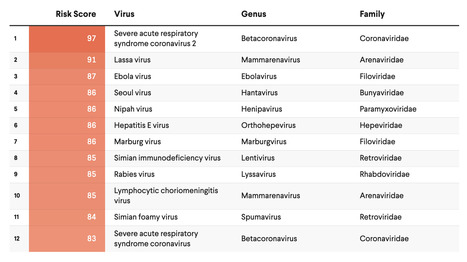
The original SpillOver risk ranking framework (SpillOver 1.0), an open-source webtool launched by researchers at the University of California, Davis One Health Institute, estimated the relative spillover potential of wildlife-origin viruses to humans based on a series of host, viral, and environmental risk factors determined via expert opinion and scientific evidence. 


Its next iteration, SpillOvers 2.0, has rebranded to better describe the diversity and frequency of virus spillovers to people. The new platform uses a One Health approach, which recognizes the interdependence of human, animal, and environmental health. It will expand to include domestic animal and vector-borne viruses and assess pandemic risk rather than just spillover risk for wildlife viruses.


No comment yet.
Scooped by nrip
Scoop.it!

Corona SEIR Workbench

Corona SEIR Workbench | Infectious Diseases | Scoop.it

Pandemic SEIR and SEIRV modelling software and infrastructure for the Corona SARS-COV-2 COVID-19 disease with data from Johns-Hopkins-University CSSE, Robert Koch-Institute and vaccination data from Our World In Data.


The SARS-COV-2 pandemic has been affecting our lives for months. The effectiveness of measures against the pandemic can be tested and predicted by using epidemiological models. The Corona SEIR Workbench uses a SEIR model and combines a graphical output of the results with a simple parameter input for the model. Modelled data can be compared country by country with the SARS-COV-2 infection data of the Johns Hopkins University. Additionally, the R₀ values of the Robert Koch Institute can be displayed for Germany. Vaccination data is used from Our World In Data.


No comment yet.
Rescooped by nrip from healthcare technology
Scoop.it!

Automated Travel History Extraction From Clinical Notes for Informing the Detection of Emergent Infectious Disease Events

Automated Travel History Extraction From Clinical Notes for Informing the Detection of Emergent Infectious Disease Events | Infectious Diseases | Scoop.it

Patient travel history can be crucial in evaluating evolving infectious disease events. Such information can be challenging to acquire in electronic health records, as it is often available only in unstructured text.


Objective: This study aims to assess the feasibility of annotating and automatically extracting travel history mentions from unstructured clinical documents in the Department of Veterans Affairs across disparate health care facilities and among millions of patients. Information about travel exposure augments existing surveillance applications for increased preparedness in responding quickly to public health threats.


Methods: Clinical documents related to arboviral disease were annotated following selection using a semiautomated bootstrapping process. Using annotated instances as training data, models were developed to extract from unstructured clinical text any mention of affirmed travel locations outside of the continental United States. Automated text processing models were evaluated, involving machine learning and neural language models for extraction accuracy.


Results: Among 4584 annotated instances, 2659 (58%) contained an affirmed mention of travel history, while 347 (7.6%) were negated. Interannotator agreement resulted in a document-level Cohen kappa of 0.776. Automated text processing accuracy (F1 85.6, 95% CI 82.5-87.9) and computational burden were acceptable such that the system can provide a rapid screen for public health events.


Conclusions: Automated extraction of patient travel history from clinical documents is feasible for enhanced passive surveillance public health systems.


Without such a system, it would usually be necessary to manually review charts to identify recent travel or lack of travel, use an electronic health record that enforces travel history documentation, or ignore this potential source of information altogether.


The development of this tool was initially motivated by emergent arboviral diseases. More recently, this system was used in the early phases of response to COVID-19 in the United States, although its utility was limited to a relatively brief window due to the rapid domestic spread of the virus.


Such systems may aid future efforts to prevent and contain the spread of infectious diseases.


read the study at https://publichealth.jmir.org/2021/3/e26719


nrip's curator insight, June 15, 2021 11:26 PM

Information about travel exposure augments existing surveillance applications for increased preparedness in responding quickly to public health threats. Using algorithms and/or learning models to extract travel related information from EHR's is not a novel concept but it has come into the spotlight(like most of digital health) in the past 18 months.


We should be adding short travel related questionnaires in patient intake forms going forward. The symptoms which trigger this sort of an intake form for a particular patient can change with time, month to month preferably, and be governed by a multi regional , multi national approach. What do you think?


Scooped by nrip
Scoop.it!

R's not all you need

R's not all you need | Infectious Diseases | Scoop.it

When it comes to loosening COVID restrictions all eyes are usually trained on the famous R number. But as epidemiologists Julia Gog and Thomas House recently explained to us, there's also another important factor to consider alongside R. That's the prevalence of COVID-19 in the population: the proportion of people who currently have the disease.


Put simply, if prevalence has been so high that the NHS is in crisis, then opening up might stretch it to breaking point, even if R is less than 1, or would remain so. If, on the other hand, prevalence is very low, we might be able to tolerate a higher value of R as it would not immediately lead to many cases. This is true particularly if prevalence has been low for some time.


We've illustrated this idea in the schematic plot below. The vertical axis measures prevalence and the horizontal axis measures R. Any point on this plot, such as the one we marked in black right in the middle, corresponds to a situation where we have the value of R that lies directly beneath the point on the horizontal axis, and the value of prevalence that lies directly to the left of the point on the vertical axis


read this excellent piece at https://plus.maths.org/content/R-not-all?nl=0

No comment yet.